
Efficient Python for Data Scientists Course [10/14]: Transforming Data Effectively With .groupby()

In this article, we will discuss how to use the .groupby() function effectively to group the entries of a DataFrame according to the values of a specific feature.
The .groupby() method is applied to a DataFrame and groups it according to a feature. Then, we can apply some simple or more complicated functions on that grouped object.
This is a very important tool for every data scientist working on tabular or structured data, as it will help you to manipulate data easily and in a more effective way.

Table of Contents:
Common functions used with .groupby()
Missing value imputation using .groupby() & .transform( )
Data filtration using the .groupby() & .filter()
Get All My Books, One Button Away With 40% Off

I have created a bundle for my books and roadmaps, so you can buy everything with just one button and for 40% less than the original price. The bundle features 8 eBooks, including:
1. Common functions used with .groupby()
One of the simplest methods to apply to an aggregated group is the .count(). In the example below, we will apply this to the restaurant dataset.
At first, we group the restaurant data according to whether the customer was a smoker or not. Then, we apply the .count() method. We obtain the count of smokers and non-smokers.
restaurant = pd.read_csv(’restaurant_data.csv’)

restaurant_grouped = restaurant.groupby(’smoker’)
print(restaurant_grouped.count())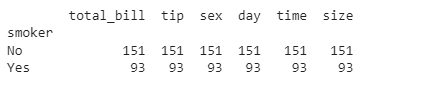
It is no surprise that we get the same results for all the features, as the .count() method counts the number of occurrences of each group in each feature. As there are no missing values in our data, the results should be the same in all columns.
After grouping the entries of the DataFrame according to the values of a specific feature, we can apply any transformation we are interested in.
Here, we are going to apply the z score, a normalization transformation, which is the distance between each value and the mean, divided by the standard deviation.
This is a very useful transformation in statistics, often used with the z-test in standardized testing. To apply this transformation to the grouped object, we just need to call the .transform() method containing the lambda transformation we defined.
This time, we will group according to the type of meal: was it a dinner or a lunch? As the z-score transformation is group-related, the resulting table is just the original table.
For each element, we subtract the mean and divide it by the standard deviation of the group it belongs to. We can also see that numerical transformations are applied only to numerical features of the DataFrame.
zscore = lambda x: (x - x.mean() ) / x.std()

restaurant_grouped = restaurant.groupby(’time’)

restaurant_transformed = restaurant_grouped.transform(zscore)
restaurant_transformed.head()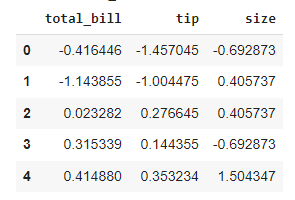
While the transform() method simplifies things a lot, is it actually more efficient than using native Python code? As we did before, we first group our data, this time according to sex.
Then we apply the z-score transformation we applied before, measuring its efficiency. We omit the code for measuring the time of each operation here, as you are already familiar with this.
We can see that with the use of the transform() function, we achieve a massive speed improvement. On top of that, we’re only using one line to operate against interest.
restaurant.groupby(’sex’).transform(zscore)

mean_female = restaurant.groupby(’sex’).mean()[’total_bill’][’Female’]
mean_male = restaurant.groupby(’sex’).mean()[’total_bill’][’Male’]
std_female = restaurant.groupby(’sex’).std()[’total_bill’][’Female’]
std_male = restaurant.groupby(’sex’).std()[’total_bill’][’Male’]

for i in range(len(restaurant)):

  if restaurant.iloc[i][2] == ‘Female’:
    restaurant.iloc[i][0] = (restaurant.iloc[i][0] - mean_female)/std_female

  else:
    restaurant.iloc[i][0] = (restaurant.iloc[i][0] - mean_male)/std_male
2. Missing value imputation using .groupby() & .transform( )
Now that we have seen why and how to use the transform() function on a grouped pandas object, we will address a very specific task that is imputing missing values.
Before we actually see how we can use the transform() function for missing value imputation, we will see how many missing values there are in our variable of interest in each of the groups. We can see below the number of data points in each of the “time” features, and they are 176+68 = 244.
prior_counts = restaurant.groupby(’time’)
prior_counts[’total_bill’].count()
Next, we will create a restaurant_nan dataset, in which the total bill of 10% random observations was set to NaN using the code below:
import pandas as pd
import numpy as np

p = 0.1 #percentage missing data required

mask = np.random.choice([np.nan,1], size=len(restaurant), p=[p,1-p])
restaurant_nan = restaurant.copy()
restaurant_nan[’total_bill’] =  restaurant_nan[’total_bill’] * mask
Now, let’s print the number of data points in each of the “time” features, and we can see that they are now 155 + 62 = 217. Since the total data points we have are 244, then the missing data points are 24, which is equal to 10%.
prior_counts = restaurant.groupby(’time’)
prior_counts[’total_bill’].count()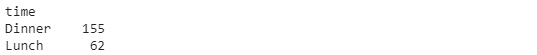
After counting the number of missing values in our data, we will show how to fill these missing values with a group-specific function. The most common choices are the mean and the median, and the selection has to do with the skewness of the data.
As we did before, we define a lambda transformation using the fillna() function to replace every missing value with its group average. As before, we group our data according to the time of the meal and then replace the missing values by applying the pre-defined transformation.
# Missing value imputation

missing_trans = lambda x: x.fillna(x.mean())
restaurant_nan_grouped = restaurant_nan.groupby(’time’)[’total_bill’]
restaurant_nan_grouped.transform(missing_trans)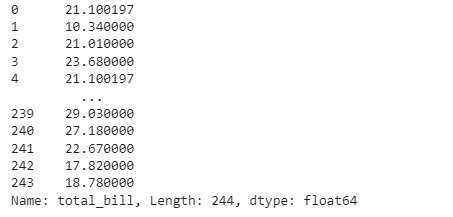
As we can see, the observations at index 0 and index 4 are the same, which means that their missing value has been replaced by their group’s mean.
Also, we can see that the computation time using this method is 0.007 seconds.

Let’s compare this with the conventional method:
start_time = time.time()
mean_din = restaurant_nan.loc[restaurant_nan.time ==’Dinner’][’total_bill’].mean()
mean_lun = restaurant_nan.loc[restaurant_nan.time == ‘Lunch’][’total_bill’].mean()

for row in range(len(restaurant_nan)):
  if restaurant_nan.iloc[row][’time’] == ‘Dinner’:
    restaurant_nan.loc[row, ‘total_time’] = mean_din
  else:
    restaurant_nan.loc[row, ‘total_time’] = mean_lun

print(”Results from the above operation calculated in %s seconds” % (time.time() - start_time))
We can see that using the .transform() function applied to a grouped object performs faster than the native Python code for this task.
3. Data filtration using the .groupby() & .filter()
Now we will discuss how we can use the filter() function on a grouped pandas object. This allows us to include only a subset of those groups, based on some specific conditions.
Often, after grouping the entries of a DataFrame according to a specific feature, we are interested in including only a subset of those groups, based on some conditions.
Some examples of filtration conditions are the number of missing values, the mean of a specific feature, or the number of occurrences of the group in the dataset.
We are interested in finding the mean amount of tips given on the days when the mean amount paid to the waiter is more than 20 USD. The .filter() function accepts a lambda function that operates on a DataFrame of each of the groups.
In this example, the lambda function selects “total_bill” and checks that the mean() is greater than 20. If that lambda function returns True, then the mean() of the tip is calculated.
If we compare the total mean of the tips, we can see that there is a difference between the two values, meaning that the filtering was performed correctly.
restaurant_grouped = restaurant.groupby(’day’)
filter_trans = lambda x : x[’total_bill’].mean() > 20
restaurant_filtered = restaurant_grouped.filter(filter_trans)

print(restaurant_filtered[’tip’].mean())

print(restaurant[’tip’].mean())
If we attempt to perform this operation without using groupby(), we end up with this inefficient code. At first, we use a list comprehension to extract the entries of the DataFrame that refer to days that have a mean meal greater than $20, and then use a for loop to append them to a list and calculate the mean. It might seem very intuitive, but as we see, it’s also very inefficient.
t=[restaurant.loc[restaurant[’day’] == i][’tip’] for i in restaurant[’day’].unique()
  if restaurant.loc[restaurant[’day’] == i][’total_bill’].mean()>20]
restaurant_filtered = t[0]

for j in t[1:]:
  restaurant_filtered=restaurant_filtered.append(j,ignore_index=True)
This newsletter is a personal passion project, and your support helps keep it alive. If you would like to contribute, there are a few great ways:
Subscribe. A paid subscription helps to make my writing sustainable and gives you access to additional content.*
Grab a copy of my book Bundle. Get my 7 hands-on books and roadmaps for only 40% of the price
Thanks for reading, and for helping support independent writing and research!