
Efficient Python for Data Scientists Course [14/14] : Data Exploration Becomes Easier & Better With Pandas Profiling
How to Use the Pandas Profiling for Better EDA

Data exploration is a crucial step in any data analysis and data science project. It allows you to gain a deeper understanding of your data, identify patterns and relationships, and identify any potential issues or outliers.
One of the most popular tools for data exploration is the Python library Pandas. The library provides a powerful set of tools for working with data, including data cleaning, transformation, and visualization. However, even with the powerful capabilities of Pandas, data exploration can still be a time-consuming and tedious task. That’s where Pandas Profiling comes in.
With Pandas Profiling, you can easily generate detailed reports of your data, including summary statistics, missing values, and correlations, making data exploration faster and more efficient. This article will explore how Pandas Profiling can help you improve your data exploration process and make it easier to understand your data.

Table of Contents:
What is Pandas Profiling?
Installation of Pandas Profiling
Pandas Profiling in Action
Drawbacks of Pandas Profiling & How to Overcome Them
You can find the data and the code used in this blog in this GitHub repository.
Get All My Books, One Button Away With 40% Off

I have created a bundle for my books and roadmaps, so you can buy everything with just one button and for 40% less than the original price. The bundle features 8 eBooks, including:
1. What is Pandas Profiling?
Pandas profiling is a Python library that generates a comprehensive report of a DataFrame, including information about the number of rows and columns, missing values, data types, and other statistics. It can be used to quickly identify potential issues or outliers in the data, and can also be used to generate summary statistics and visualizations of the data.
The report generated by the pandas profiling library typically includes a variety of information about the dataset, including:
Overview: Summary statistics for all columns, including the number of rows, missing values, and data types.
Variables: Information about each column, including the number of unique values, missing values, and the top frequent values.
Correlations: Correlation matrix and heatmap, showing the relationship between different variables.
Distribution: Histograms and kernel density plots for each column show the distribution of values.
Categorical Variables: Bar plots for categorical variables, showing the frequency of each category.
Numerical Variables: Box plots for numerical variables show the distribution of values and outliers.
Text: Information about text columns, including the number of characters and words.
File: Information about file columns, including the number of files and the size of each file.
High-Cardinality: Information about high-cardinality categorical variables, including their most frequent values.
Sample: A sample of the data, with the first and last few rows displayed.
It is worth noting that the report is interactive, and you can drill down on each section for more details.
2. Installation of Pandas Profiling
To install pandas-profiling, you can use the following command in your terminal or command prompt:
pip install pandas-profilingThis will install the latest version of pandas-profiling and its dependencies.
If you are using Jupyter Notebook, you can also install it by running the following command in a cell:
!pip install pandas-profilingYou can also make the installation using the conda package using the command below:
conda install -c conda-forge pandas-profilingIf it did not work with you and gave you this error below
ImportError: cannot import name ‘to_html’ from ‘pandas_profiling.report’ (C:\Users\youss\anaconda3\lib\site-packages\pandas_profiling\report\__init__.py)You can use this command in your Jupyter notebook:
import sys

!”{sys.executable}” -m pip install -U pandas-profiling[notebook]
!jupyter nbextension enable --py widgetsnbextension
Once installed, you can import and use pandas_profiling in your code as follows:
import pandas_profiling as pp3. Pandas Profiling in Action
Let’s put the pandas profiling into action and see how it works. We will use the popular baby names dataset.
Popular_baby_names_df = pd.read_csv(’Popular_Baby_Names.csv’)
Popular_baby_names_df.head()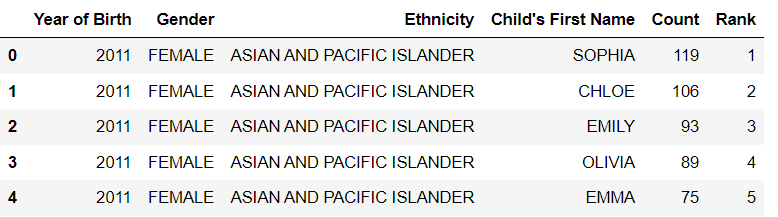
Let’s run the pandas profiling and observe the output:
profile = pp.ProfileReport(Popular_baby_names_df, title=’Pandas Profiling Report’)

# display the report
profile.to_widgets()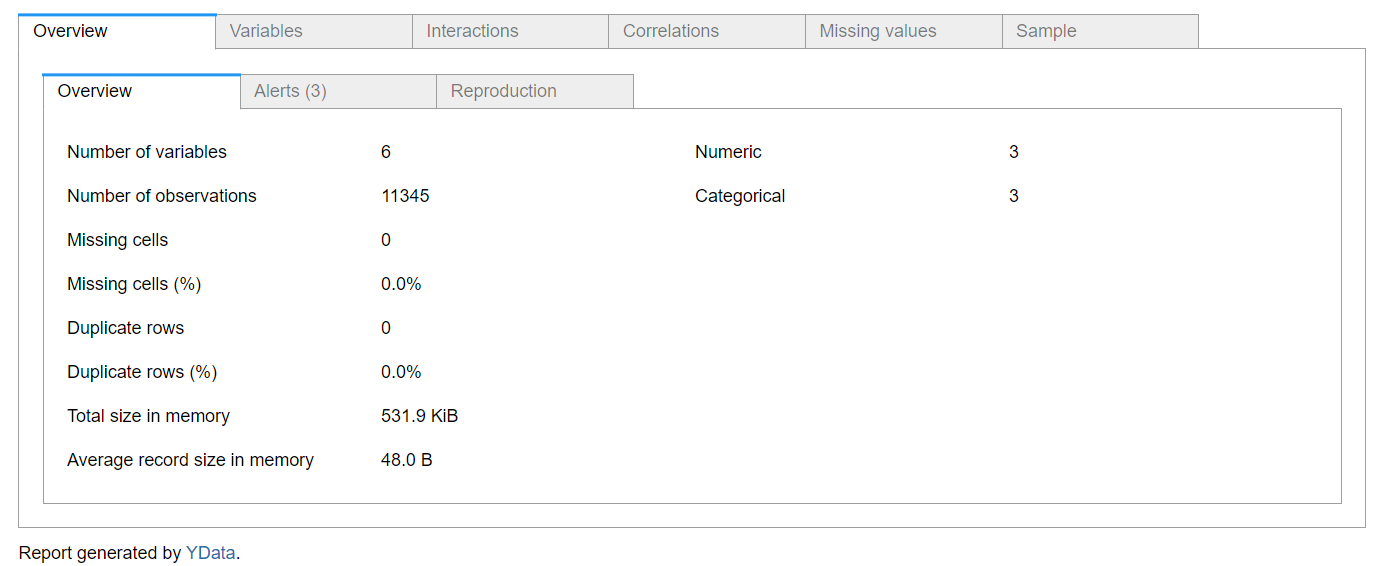
As you can see, the report contains the six sections that we mentioned before. Let’s see every section and discuss it one by one.
3.1. Overview
The first section, which is represented in the figure above, is the overview. This section contains three subsections, which are overview, alerts, and reproduction.
The overview contains information about the data, such as:
number of the features
number of observations
missing datapoints
number of duplicate rows
total memory size
The information in this section is really important for feature engineering and processing, especially the information related to the missing data points and the number of duplicate rows.
The second subsection of the overview section is the arrests, which contain alerts about the data, as shown in the figure below:
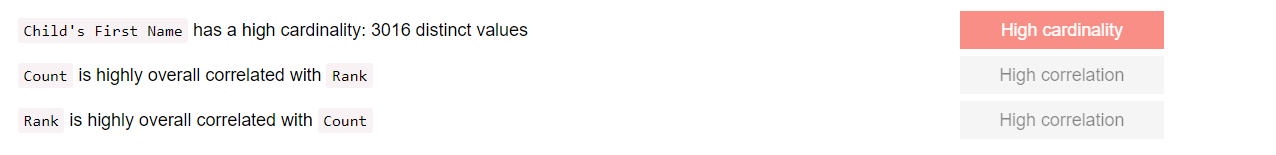
This shows areas that you can take care of during correlation. For example, if certain values are correlated with each other, it will be shown so you can drop one of them, or you can apply a dimension reduction algorithm to remove the redundant information.
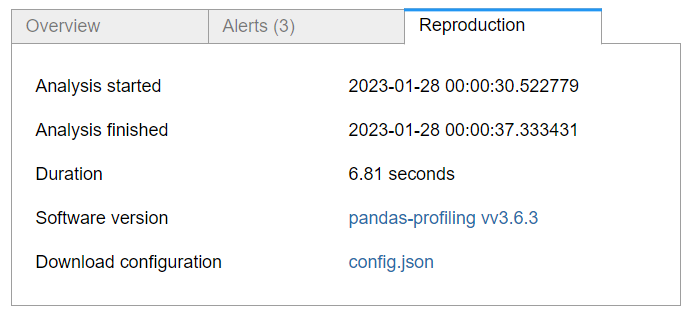
This shows the meta-information about the report, such as the duration taken to generate the report and the time when this report was generated.
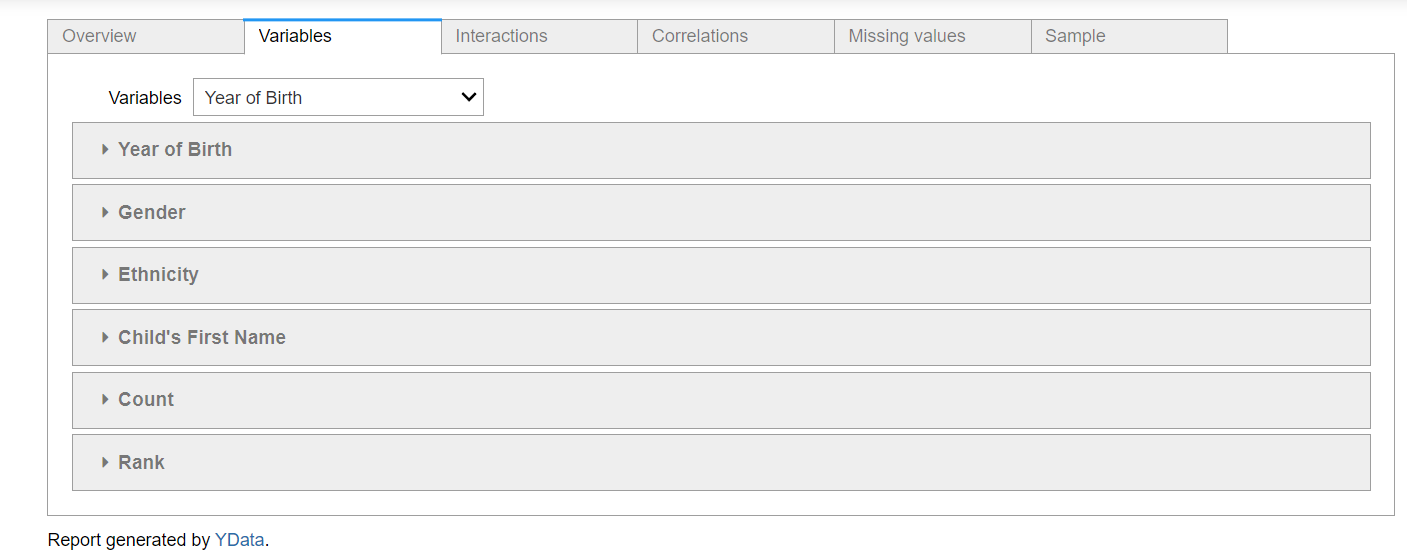
3.2. Variables
This section will show information about each feature with a plot that represents its distribution.
Here is the plot for this section, and as you can see, there are subsections for each of the features in the data.
Let’s take the plot for the first feature, which is the Year of Birth. We can see all the statistical information about the feature, such as the minimum and maximum values, the number of missing values, and the mean. In addition to that, there is a histogram plot that shows the distribution of the data.
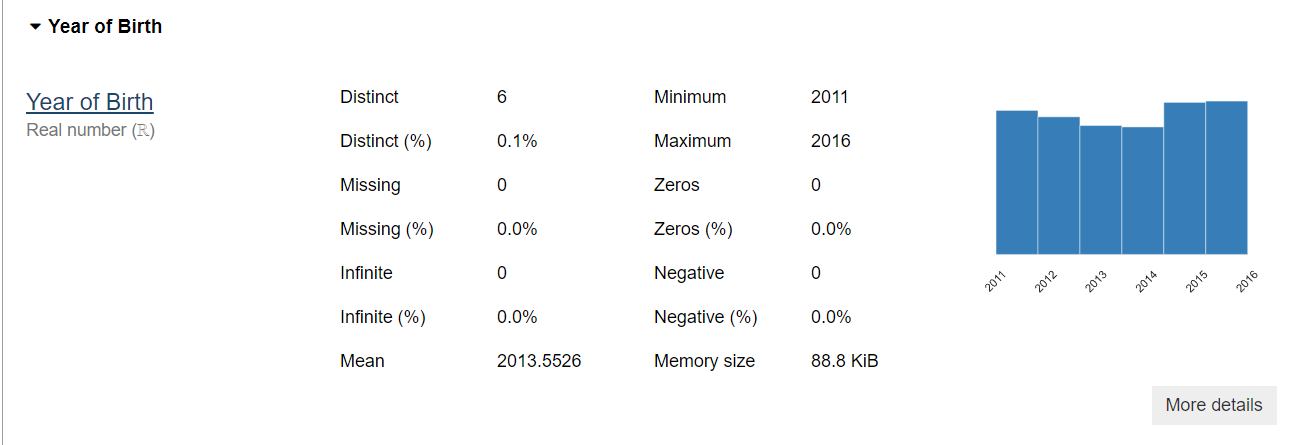
This section is really useful for understanding the feature and will save you a lot of time in feature processing.
3.3. Interaction
The third section in the report is the interaction section. This section will show you the relation between each numerical feature with the other features. For example, let’s have a look at the interaction between the rank and the count feature:
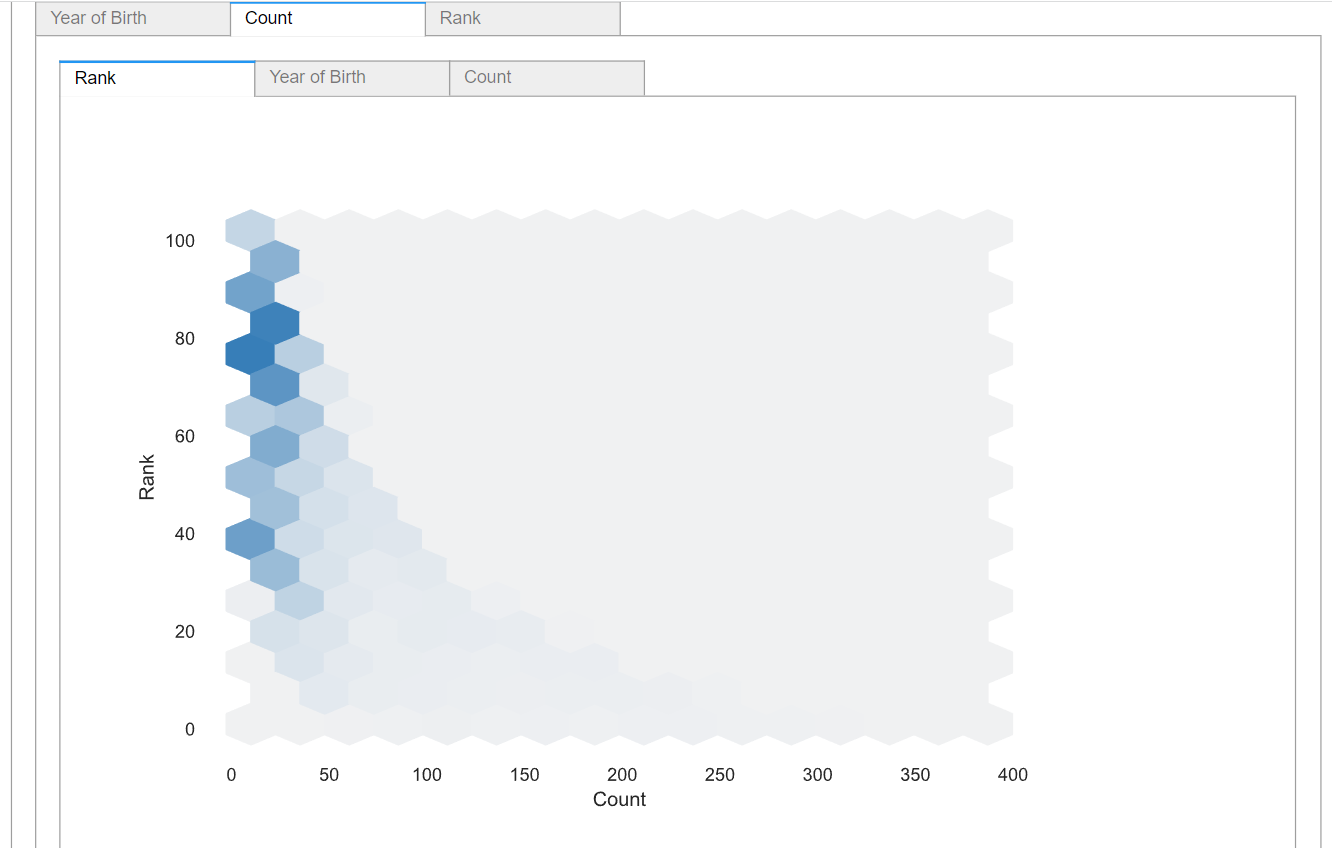
We can see the relation between the count and the Rank feature, and it also shows that they are highly correlated ( negatively ), as expected.
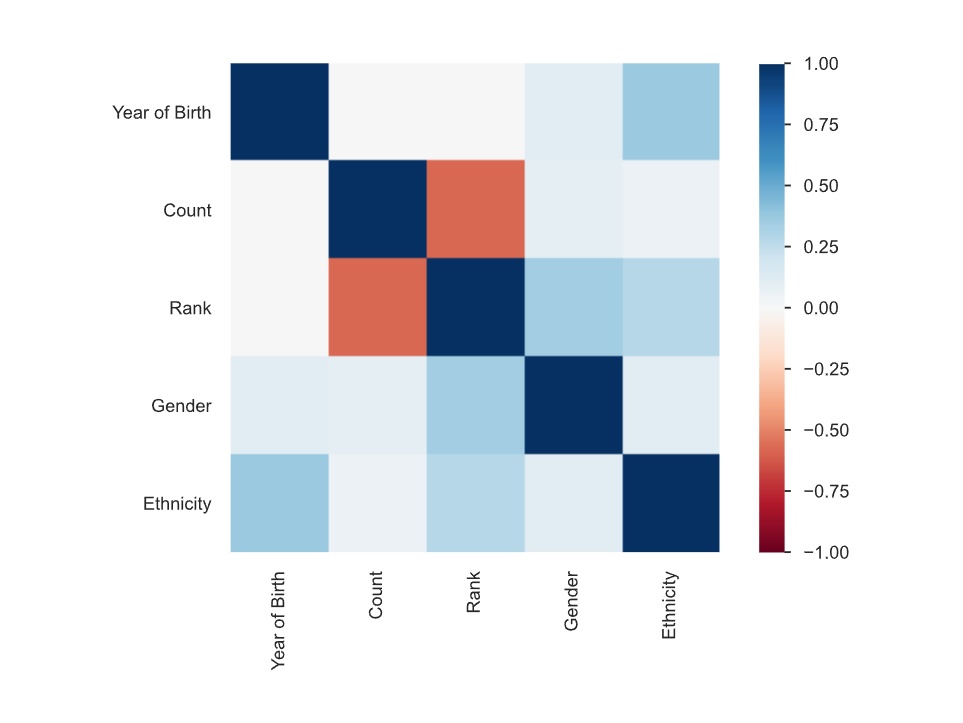
3.4. Correlations
The fourth section of the report is the correlation section. This provides a heatmap that shows the correlation between the features. In addition to the heatmap, it also provides the correlation value between each of the features, as shown below:
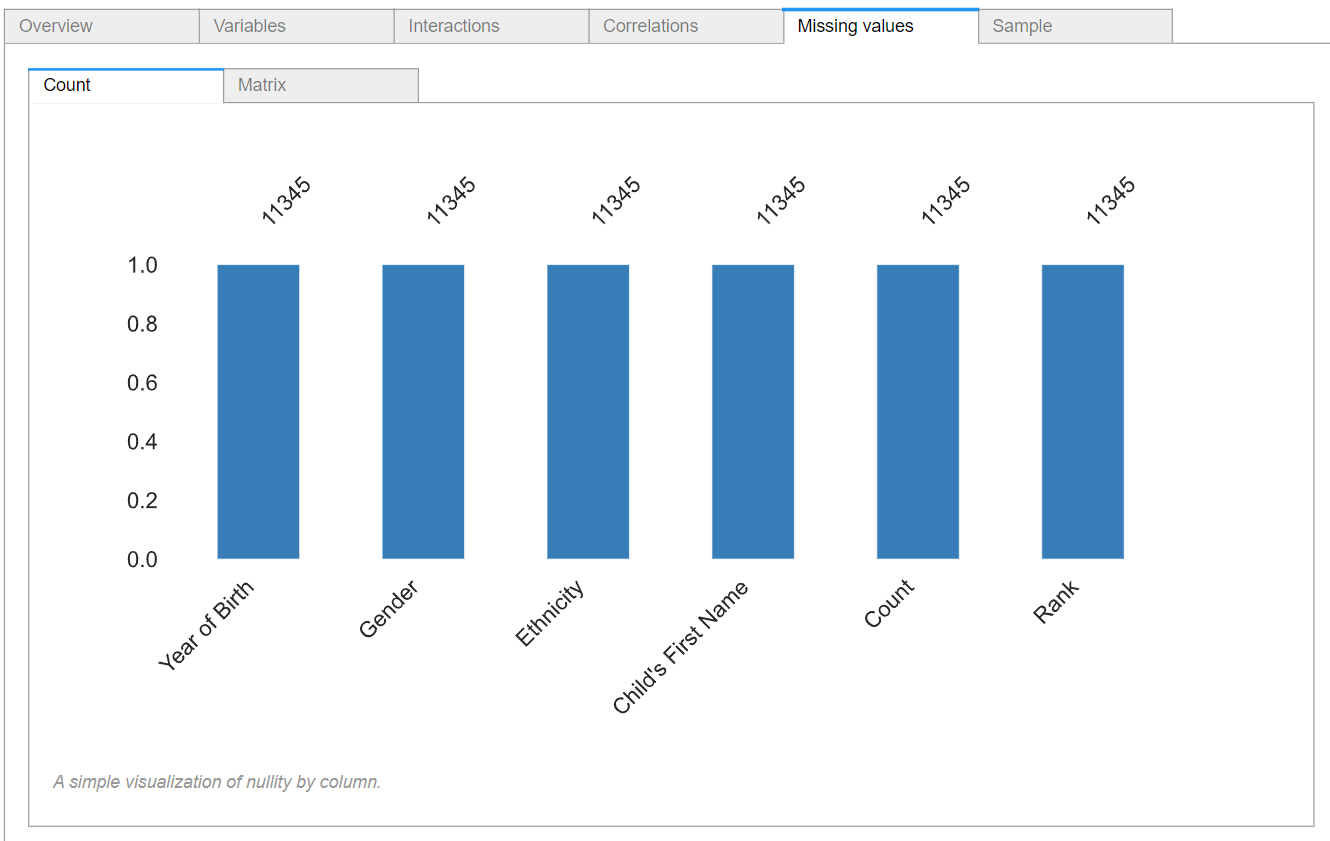
3.5. Missing Values
The fifth section is the missing values section. This shows the percentage of missing values in each feature. Since here we have no missing data, all of the features have a value of 1.
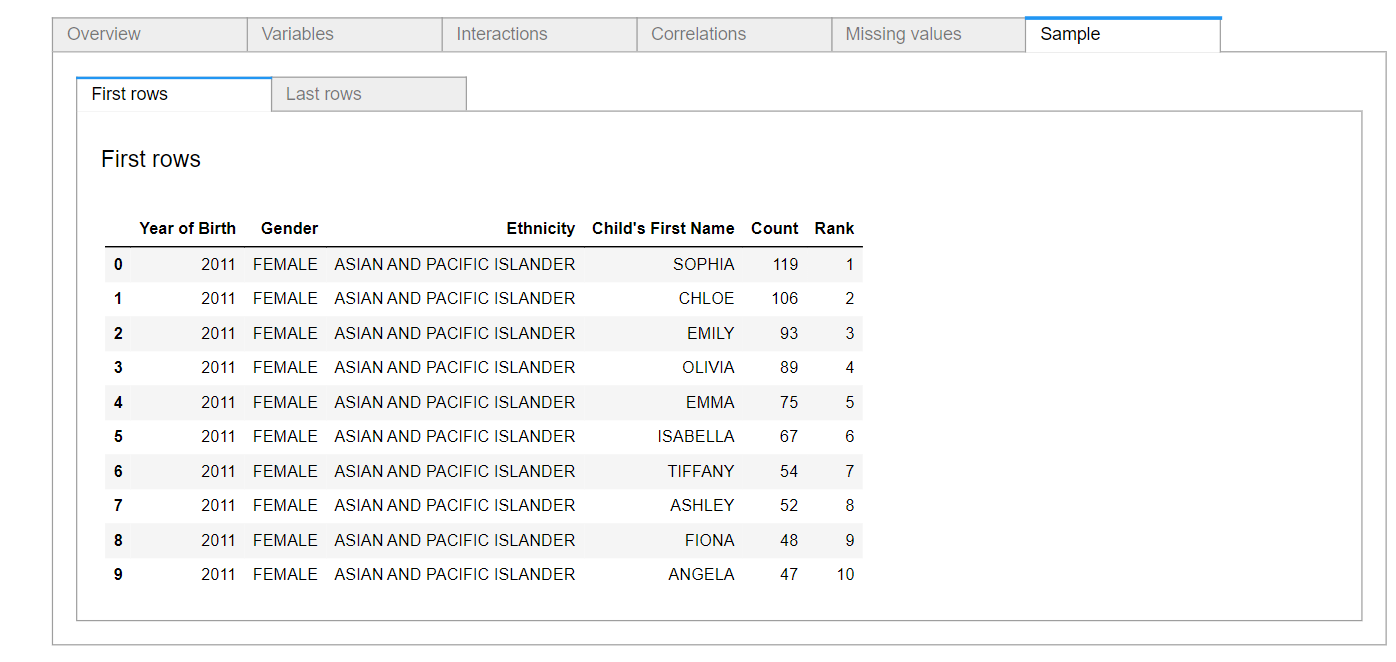
3.6. Samples
The final section of the report is the samples section. This shows you a sample of the data from the first and the last rows. The figure below shows the first ten rows of the data.
4. Drawbacks of Pandas Profiling & How to Overcome Them
Pandas Profiling is a great tool for quickly generating detailed reports of your data, but it does have some drawbacks. One of the main drawbacks is that it can be memory-intensive, especially for large datasets. This can cause the tool to run slowly or even crash if you don’t have enough memory available.
Another drawback is that Pandas Profiling can only be used with Pandas DataFrames. This means that if you’re working with data in a different format, such as a CSV file or a SQL database, you’ll need to first convert it to a Pandas DataFrame before you can use Pandas Profiling.
Additionally, Pandas Profiling generates a lot of information and can be overwhelming to digest if you don’t know what you’re looking for. The report is also not interactive, and you’ll have to export it to a file format like HTML, PDF, or Excel to share or present it.
To overcome these limitations, you can try the following:
Use Pandas Profiling on a sample of your data rather than the entire dataset to reduce memory usage.
Use Pandas to convert your data to a DataFrame before using Pandas Profiling.
Use the options in Pandas Profiling to customize the report and only include the information that you need.
Use visualization libraries like Matplotlib and Seaborn to make the report more interactive and easier to understand.
Use the report as a starting point for your data exploration, and then use other tools and techniques to dive deeper into your data.
This newsletter is a personal passion project, and your support helps keep it alive. If you would like to contribute, there are a few great ways:
Subscribe. A paid subscription helps to make my writing sustainable and gives you access to additional content.*
Grab a copy of my book Bundle. Get my 7 hands-on books and roadmaps for only 40% of the price
Thanks for reading, and for helping support independent writing and research!
Are you looking to start a career in data science and AI, but do not know how? I offer data science mentoring sessions and long-term career mentoring:

The tip about running pandas profiling on a sample first is clutch. I've crashed notebooks way too many times trying to profile huge datasets all at once. Also love that the interaction section shows you feature relationships right away, saves you from having to manually plot everything just to figure out which variables actually matter together.